
Bitcoin Liquidation Heatmap
What Is a Bitcoin Liquidation Heatmap?
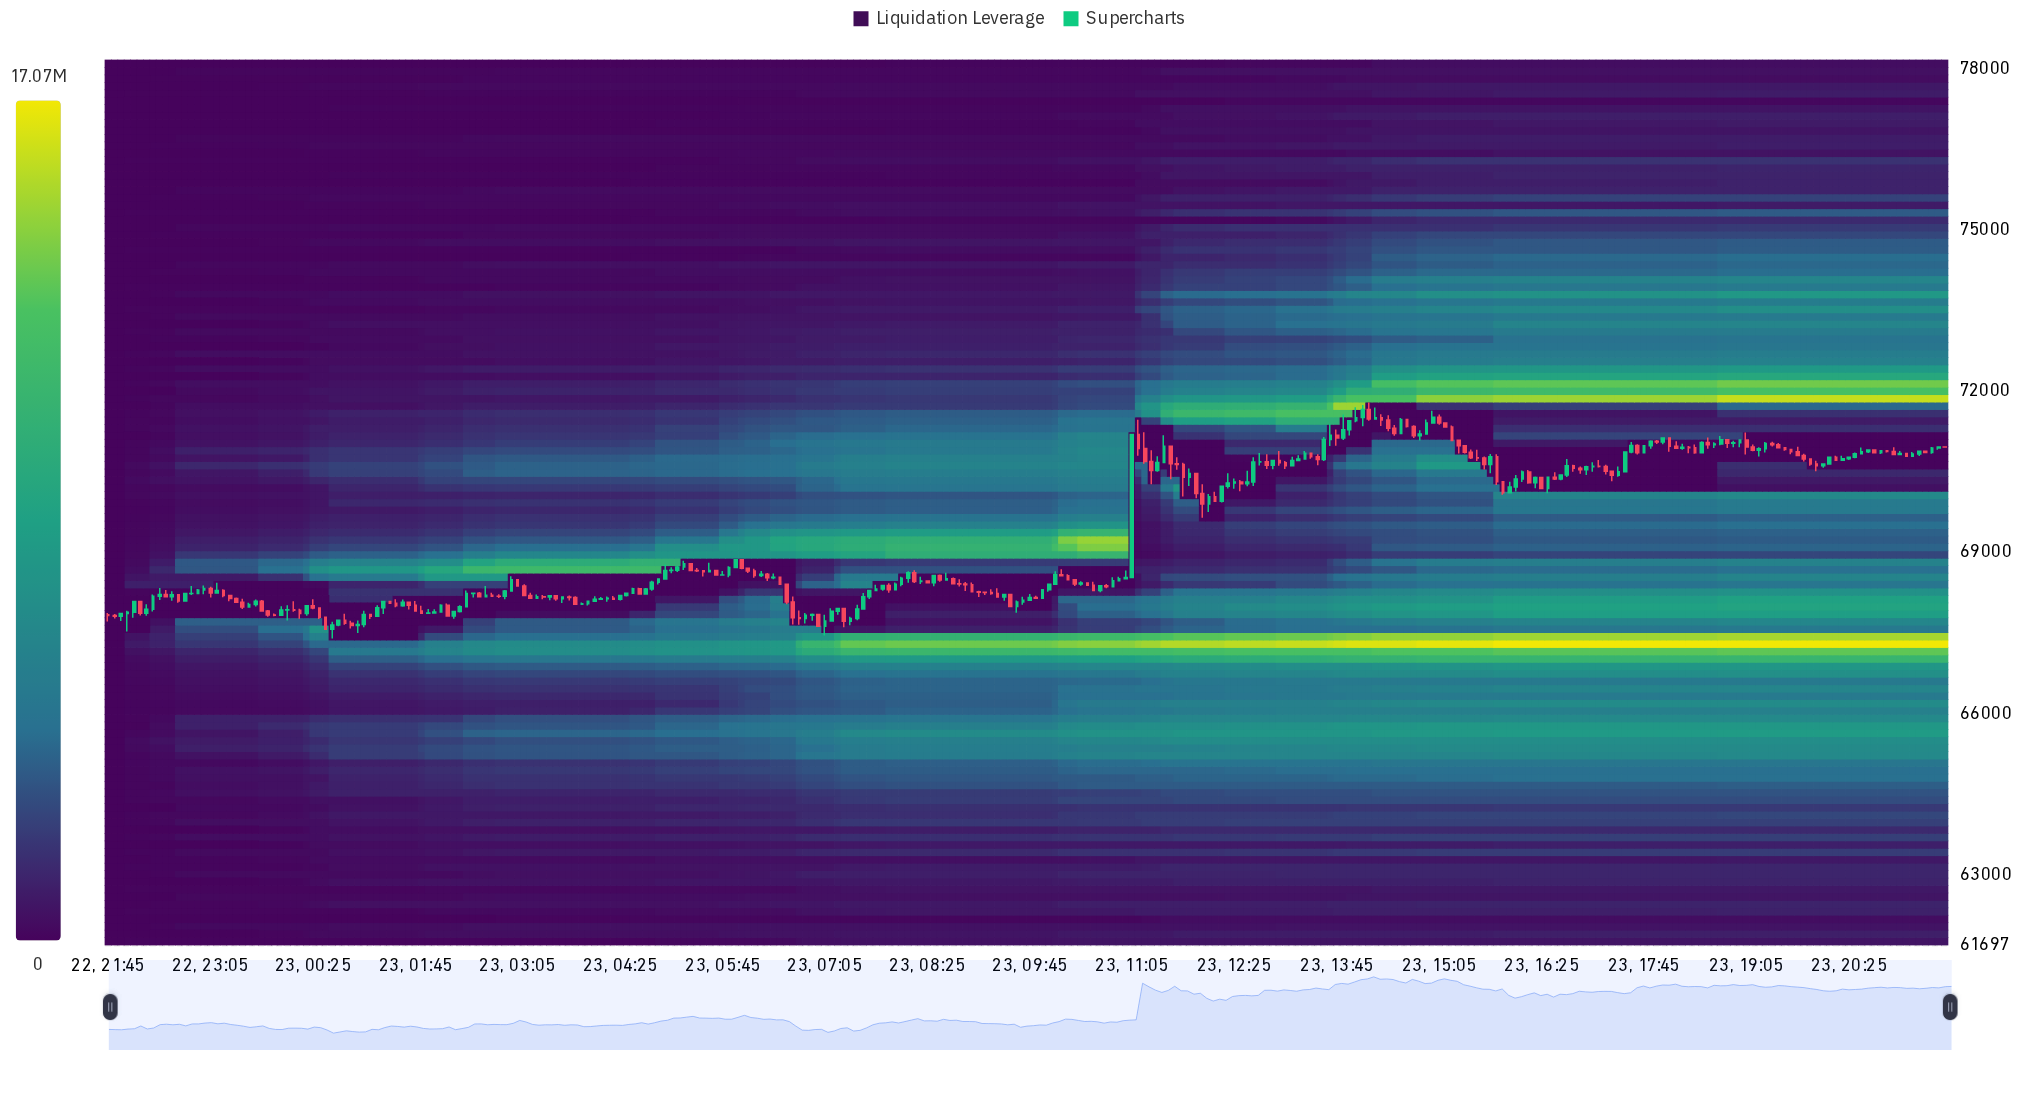
A Bitcoin liquidation heatmap is a visual representation of where leveraged futures positions — both long and short — would be forcibly closed at each price level. Because futures traders post margin, exchanges automatically liquidate positions once the price moves against them by a set amount. The heatmap aggregates millions of open positions and paints a heat gradient: the brighter the zone, the more liquidations are waiting there.
Unlike a standard order-book depth chart, a liquidation heatmap captures hidden liquidity — positions that are not yet filled but will trigger a cascade of market orders the moment price reaches those levels. Traders use this to anticipate where stop-hunts and sharp moves are most likely.
How to Read BTC Futures Liquidation Zones
- Yellow/white clusters — dense liquidation stacks; price often gravitates toward these before reversing.
- Blue/dark areas — sparse liquidations; price may pass through with less volatility.
- Horizontal bands above current price — long liquidation walls; a drop toward them may trigger a cascade.
- Horizontal bands below current price — short liquidation walls; a rally toward them may accelerate upward.
Why Liquidation Levels Matter for Bitcoin Trading
BTC futures markets carry billions of dollars in open interest at any given time. When price approaches a dense liquidation cluster, the resulting forced market orders amplify the move — shorts or longs get wiped out, sending price further in that direction before reversing. Monitoring these zones lets traders:
- Identify high-probability reversal points before entering a trade.
- Set tighter stop-losses away from liquidation-dense zones.
- Anticipate stop-hunt wicks during low-liquidity hours.
- Understand short-term price magnets driven by derivatives flow.
Bitcoin Liquidation Heatmap vs Order Book
The order book shows resting limit orders that traders have voluntarily placed. The liquidation heatmap shows forced sell/buy pressure that will appear only when price reaches a certain level. This makes the heatmap a leading indicator of where volatility will accelerate — especially in trending markets with high leverage.
How Often Is This Chart Updated?
BlockSonar refreshes the Bitcoin liquidation heatmap every hour, giving you an up-to-date snapshot of where leveraged BTC positions are stacked. Bookmark this page and check it before major news events or when price is approaching a key technical level.